
What is the greatest thing to happen to Microsoft Excel in the last 20 years? No, it is not the VLOOKUP function. In fact, this new feature that is found in Excel 2016, and a plugin for older versions of Excel, will replace your need for those long-nested formulas containing index, match, and/or VLOOKUP. No longer will you have to deal with formulas that are way too long, making it difficult to trace why they are not returning any results. There will be no need to copy multiple worksheets into one sheet, so you can summarize data with one pivot table. What is it that I am talking about? It’s Power Query.
Data Prep, Simplified
Power Query allows you to connect to data across a wide range of sources.
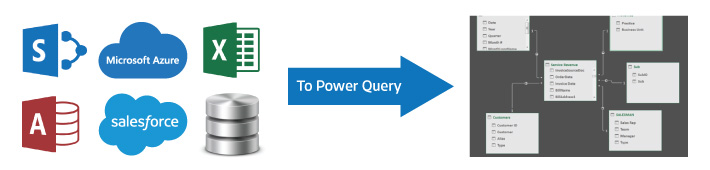
After the data connection is created in Power Query, tables are created for each data source. These tables will then be linked. You can filter, shape, append, and transform the data. All of your actions become stored procedures in the document and will automate your data prep when needed to add details to the original sources.
Now that the data is in one place, you can create a power pivot. A power pivot is like a pivot table on steroids, you have all of the data from multiple sources, and you can even add measures that allow you to add the sum from multiple columns and create a new column in the pivot table with that measure, for example, the gross profit or gross margin calculation.
Make Reports Even More Useful
In the past, I have been tasked with reporting sales for one or more years. The sales data came from many different sources and even multiple ERP systems. It was difficult to provide an ETA on the completion of these reports, because I wouldn’t know what challenges the data had. Would the three reports of the data be in PDF format or Excel format? Would all of the reports have the same columns, in the same order? Probably not, but that could not be a reason to not get the report done. Sometimes, you could use VLOOKUP, or you cut and paste, and even retype data. Hours past the anticipated deadline, the data was ready for a pivot table, and the data was formatted.
The end report generated would be detailed and sufficient, but it could have been even better if the information were broken out by company, segment, and practice. Plus, it would be useful to be able to see this information monthly, quarterly, and maybe even daily—rather than just annually. With Power Query, we’ve been able to do just that, building a report of our own sales information on Connection’s intranet that is updated weekly. There’s almost no limit to the way Power Query can help us organize data.
Ready to learn more about the new features of Microsoft Excel or other Office 365 applications? Contact us today!

Catherine Filar
Catherine has more than 20 years of experience in data analysis, data mining, financial modeling, and accounting. When she’s not crunching numbers, she enjoys spending time with her family, and she often likes to say that nothing is impossible.